
Path of least resistance
Current SPX setup, TSLA & CRWV
“For purposes of easy explanation, we will say that prices, like everything else, move along the line of least resistance. They will do whatever comes easiest, therefore they will go up if there is less resistance to an advance than to a decline; and vice versa.”—Jesse Livermore
I try not to judge people since we are all fighting our own battles. “Let he without sin cast the first stone,” so who am I to judge others?
But if you're a trader and haven't read the ‘Reminiscences of a Stock Operator,’ I can't help but judge you — to judge you like an Indian aunt when you tell her you're dropping out of medical school to pursue stand-up comedy. So, to all the traders who have reached out to me for advice, I cannot emphasize enough how important it is to read the book and reflect on its lessons.
Many questions following my last note centered on the practical application of a regime-switching model in trading. So, here it is.
The ‘path of least resistance’ for the S&P 500 has been up since April this year. In my August 25 note, I posted this:
“The Gamma and Vanna setup for SPX and SPY remains supportive heading into September OPEX. The current setup targets SPX at 6570.
My variable weighted momentum stop for SPX is now raised to 6350 — stay long biased as long as SPX does not close below 6350.”
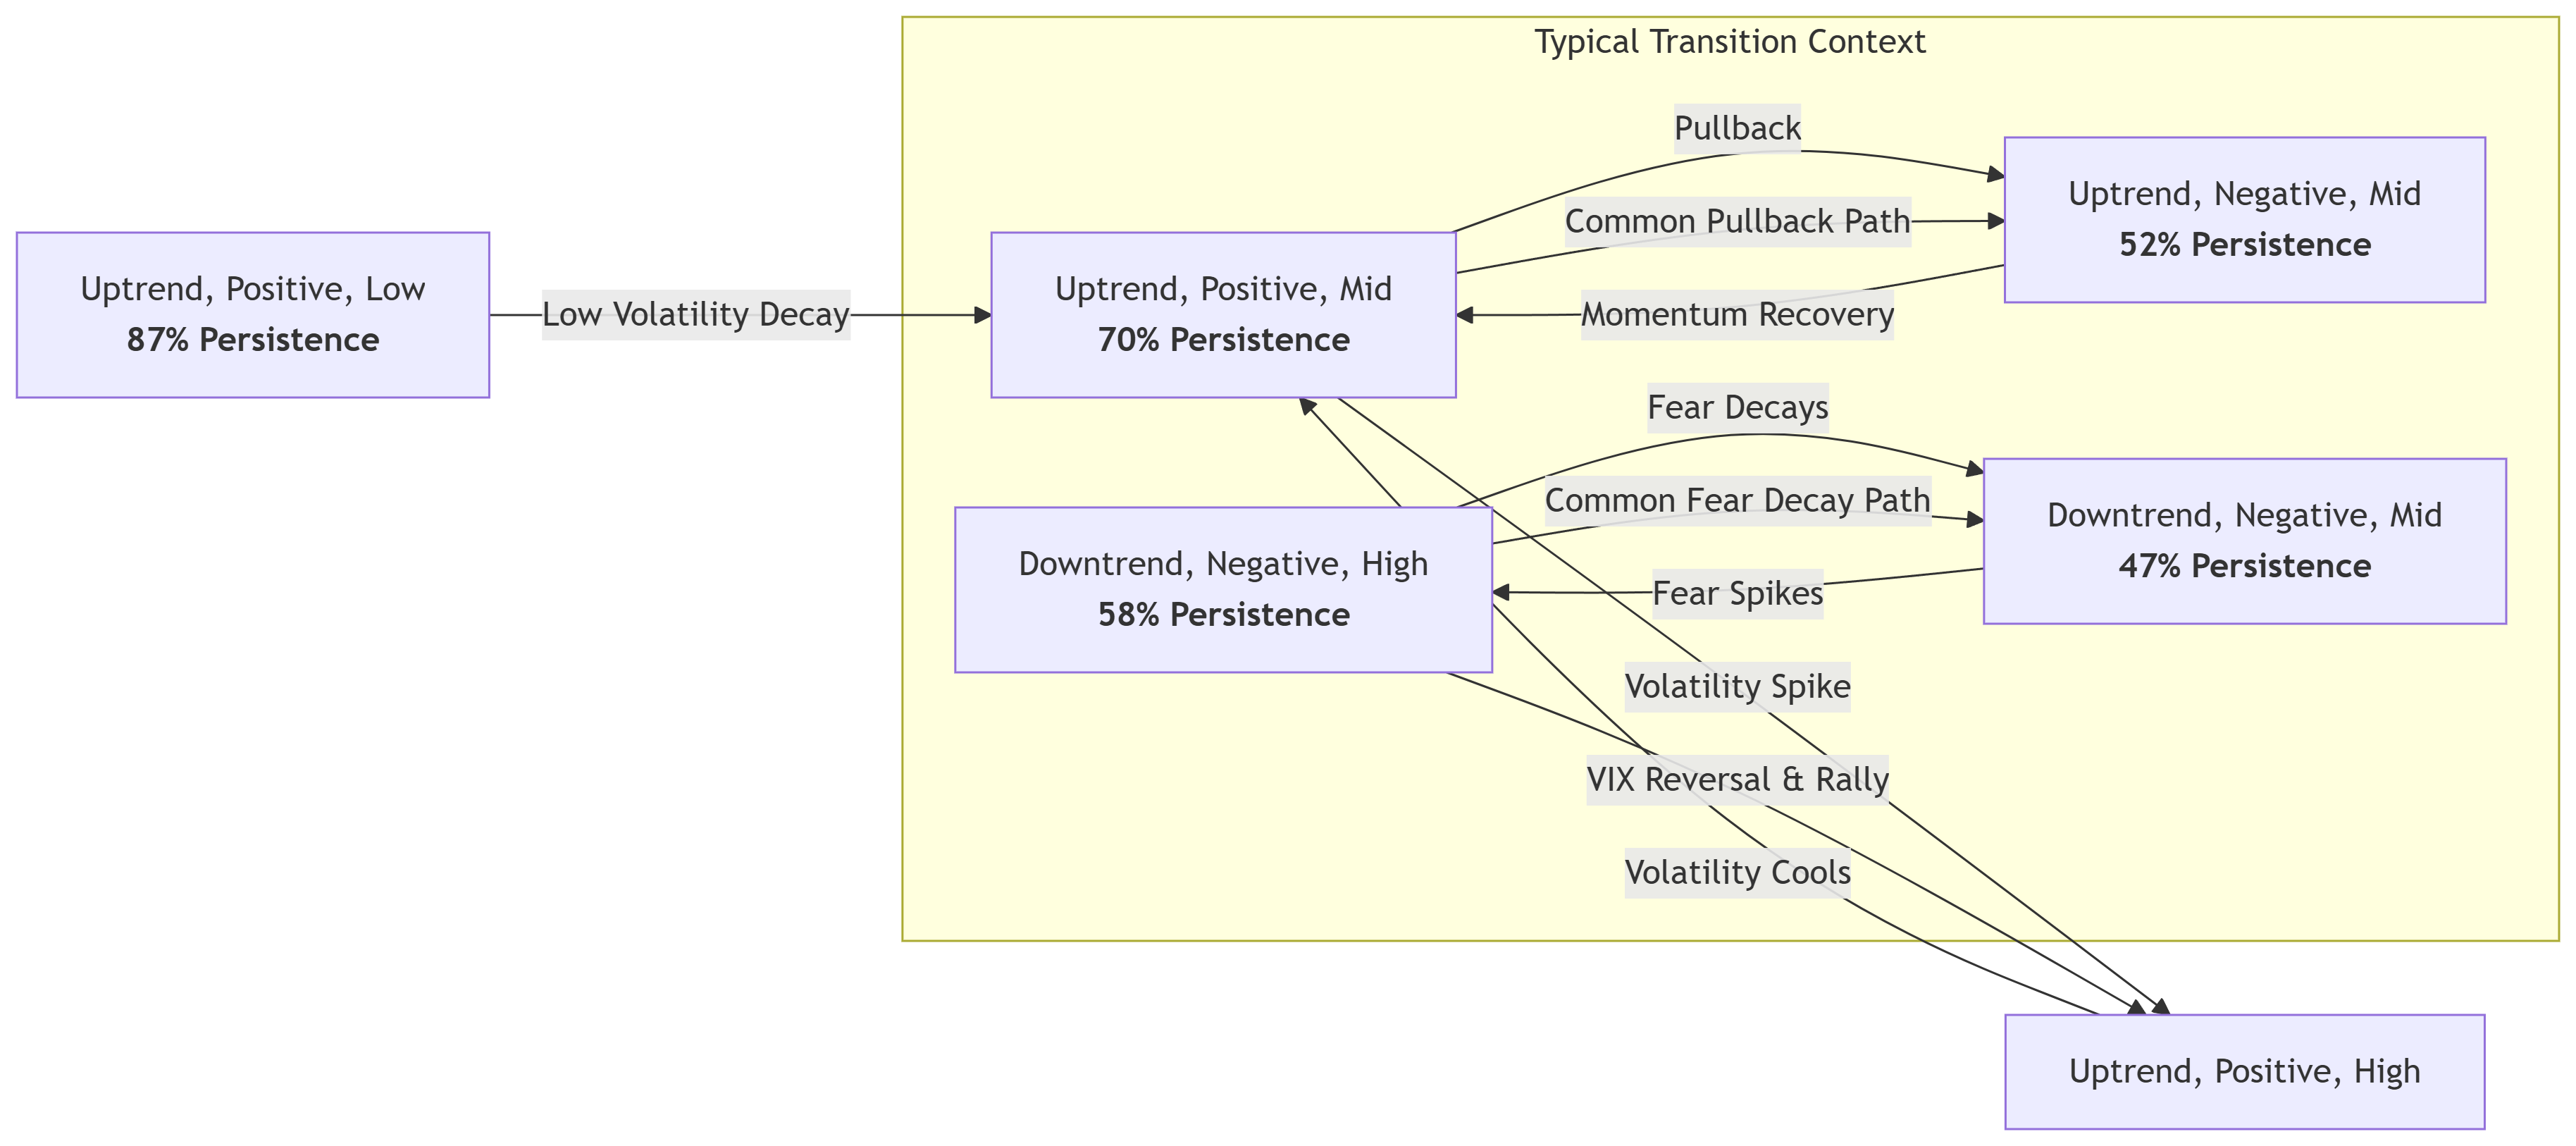
To recap my last note, I introduced a simpler version of the S&P 500 regime switching model that I use to trend-follow equities. The model provides a robust framework for understanding a stochastic system like stocks and projecting potential future scenarios based on the current regime.
The model concluded that the current S&P 500 state, characterized as ‘uptrend+positive momentum+low VIX’, has an 87% probability of repeating from one week to the next. A regime change will likely be first signaled by a rising VIX, followed by negative momentum. The path of least resistance is up unless VIX closes the week above 16.
So, going into September, the path of least resistance, as suggested by both the option complex and the S&P 500 regime-switching model, was upward.
The diagram shows common regime paths with the probability that a regime persists from week to week.
How to trade this concept of ‘the path of least resistance’
When SPX gapped down lower on September 2nd and the VIX shot higher, my primary task was simply to look for a reversal (if it occurred), since I was aware of the model-derived probabilities of trend continuation. The SPX marked a low near 6350 (which is the momentum stop) and closed higher. The next day, the option complex showed a massive gamma buildup around SPX 6400, where dealers will likely have to buy. So, when the S&P 500 gapped higher above 6400, the risk-reward ratio was favorable for going long in the direction of the path of least resistance. I added BILI, BABA, and TDW to my tactical portfolio.
It goes without saying that I had no idea what was going to happen next. I am simply trend-following in the direction of the most probable outcome.
Note: A simpler regime switching model like the one discussed in my last note will struggle during a sideways market. A more advanced model that includes additional features like breadth, sentiment, internals, volume, and economic regime performs much better at avoiding choppiness.
What next:
Stocks are attempting to price in Fed cuts, with the indices hitting new highs. However, US equities seasonality turns negative after September 16, with the FOMC meeting and OPEX on the horizon.
Based on my systematic trend-following approach, which incorporates inputs from my proprietary SPX regime model and economic regime model, the path of least resistance for stocks remains up, with the current momentum stop sitting at SPX 6450. This means that unless SPX closes below 6450, I stay long biased. And if the SPX closes below 6450, I'll stop adding new long ideas to my tactical book.
In the very short term, we're extended based on September seasonality, and I've added some negative deltas to my tactical portfolio via SPX bear call spreads and FXY.
With rate cuts on the way, some money sitting in money market funds may shift to stocks. Of course, to switch from the money market to stocks, you need to believe that US inflation won't rise further and that growth won't decline too much. FWIW, my economic regime model is showing Goldilocks with a medium probability of shifting to a stagflation-lite regime. Who knows! So, follow the trend until it bends.
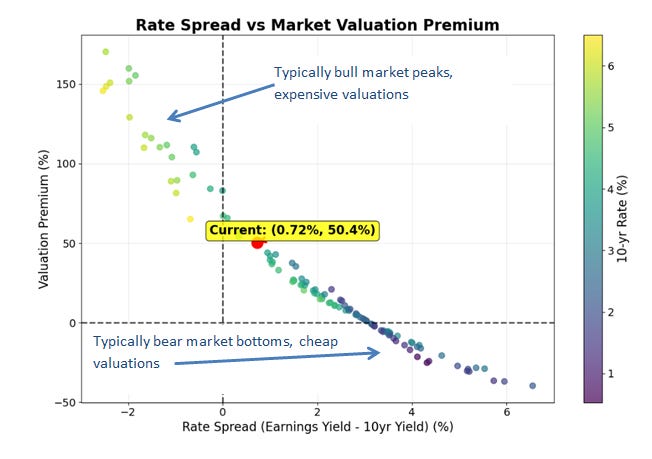
The chart below, based on data from my S&P 500 fair value model, indicates that current equity valuations are high; however, previous bull market peaks have been reached at even higher levels. Based on this graph, one sign that this bull market is nearing a peak would be if US equities and US 10-year yields begin to rise together.
As the US economy enters stagflation, consider the following analogy comparing the 1960-1980 SPX time period (blue) with the current SPX. The data correlates very well starting from 2021, when US inflation began to rise. The chart also tracks extremely well with the sharp 20% drop in March-April 2025 and the quick snap back to all-time highs.
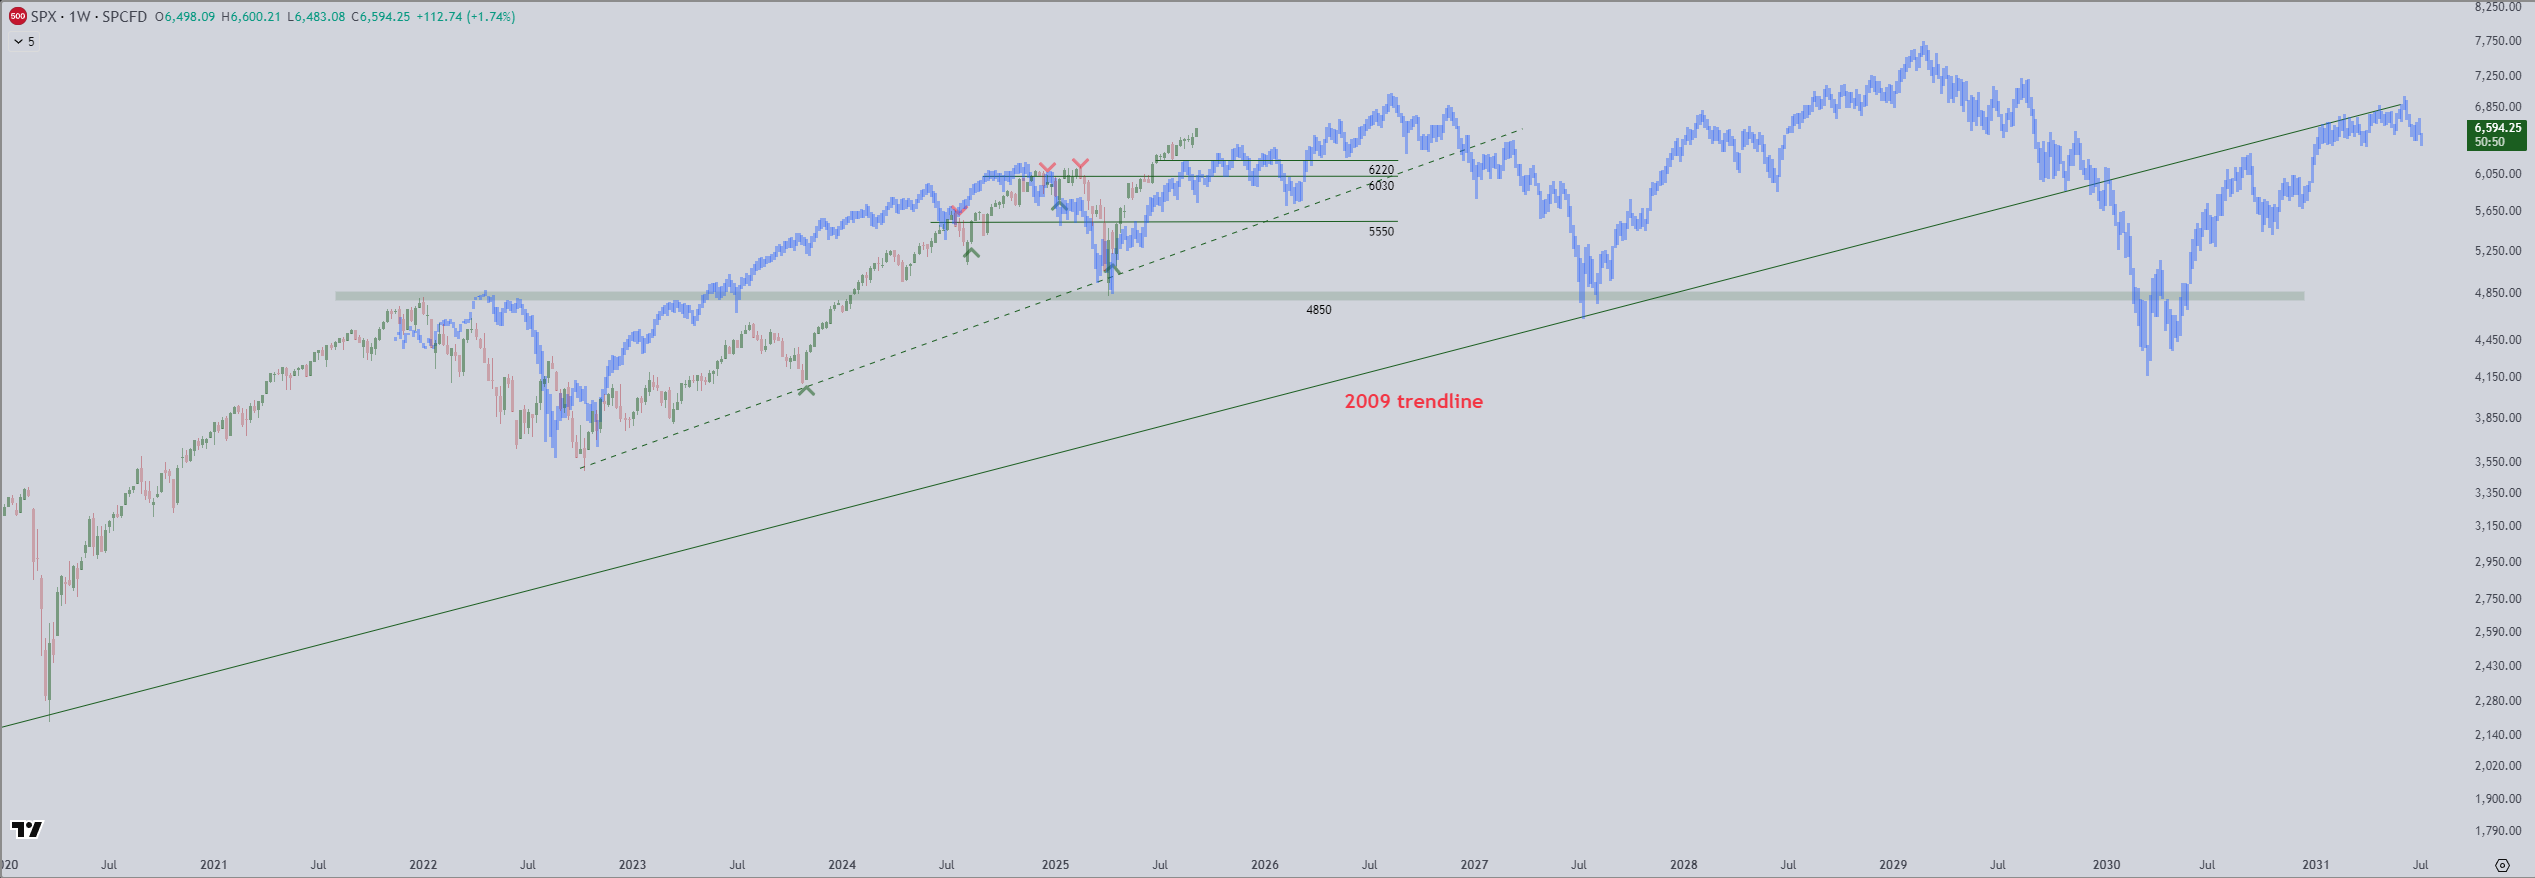
Following this analogy, SPX is entering a weaker two- to three-month period, but the next move is expected to be higher, reaching SPX 7000 by April 2026. Then, a sharp correction in 2026 to the SPX 5000, followed by a rise back up to the SPX 8000+. We’ll see.
Nevertheless, SPX 6220, 6030, and 5550 are key support levels.
For those who are short TSLA, consider this data-driven insight: the probability that a stock in a medium-term uptrend with falling realized volatility will shift to a downtrend, especially when momentum is holding, is extremely low.
I am seeing a similar setup in CRWV. I would be careful if I were short CRWV.
Updated Portfolio
Core long only: 91% long → UBER, IBIT, ETHA, COIN
Tactical long/short: BABA & BILI 40dte spreads (Idea posted here), TDW 40dte spreads (idea posted here), FXY (idea posted here), SPX 7&30 dte bear call spreads (idea posted here), AMZN Sept19 spreads (held from 209 in June).
Closed this week: XHB & XHB spreads (+2.7%), AMZN spreads (1.6%)
Cheers and good luck!
Great post! Reminisce of a stock operator is by far one of my favorite books. I think I’ve read it over 10 times at this point 🙈
Great stuff Manjeet!