
Dragon Hunting 2
Not the Nasdaq
Recap of my last note from Apr 18:
“The rally looks climactic to me, especially given that we did not see capitulation at the lows.
But the current setup of ‘positive momentum+uptrend+falling VIX’ has a 48.1% win rate (lower as SPX has run up), a Profit Factor of 3.2 with a 5.1% MAE stop.
In plain English, expect a pullback, but you have to be leaning long.”
I was wrong to think the climactic rally in SPX would pause. Thankfully, as I have mentioned before, I make a living by ignoring what I think. My trend momentum model’s positive bias kept me long and on the right side of the trade.
Current Setup
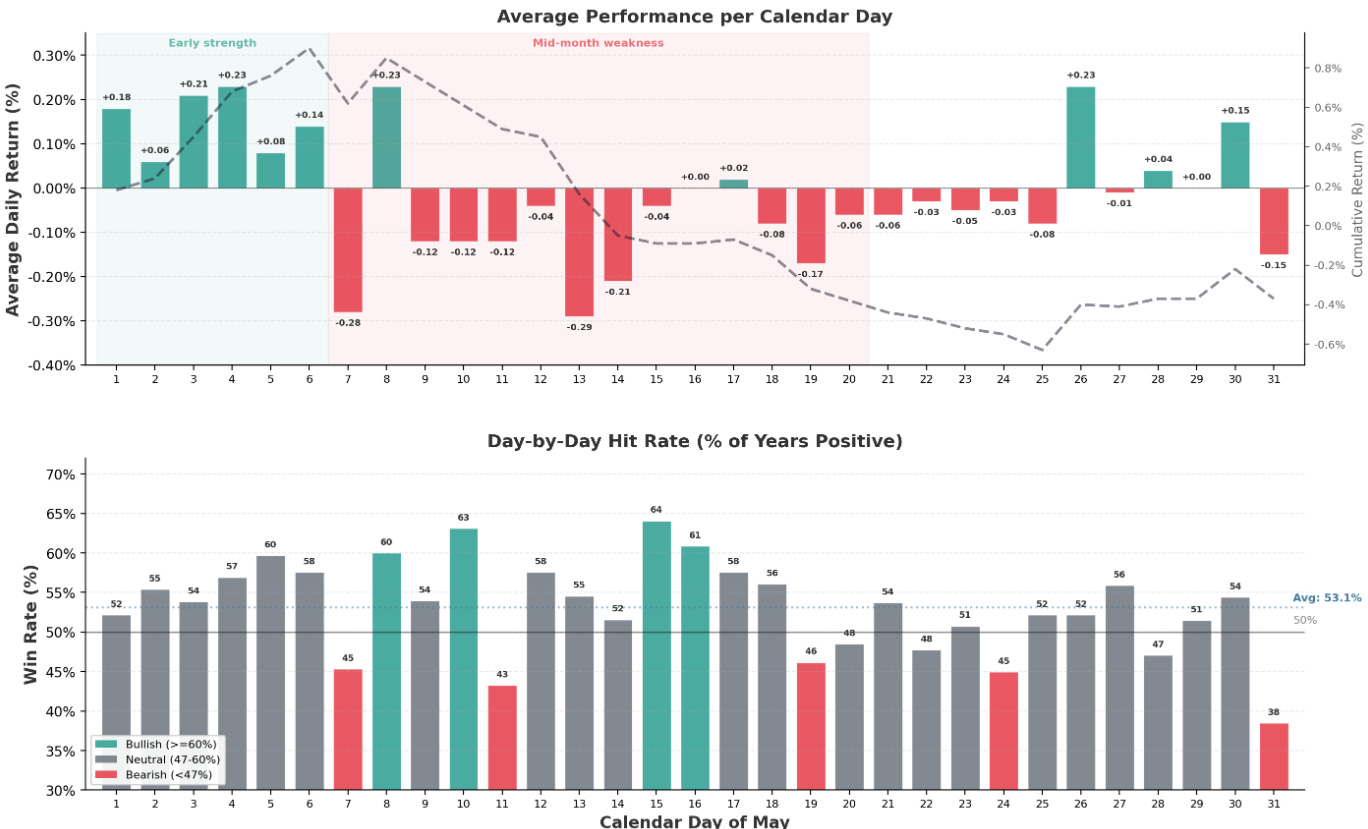
SPX is approaching a period of weaker seasonal performance.
The SPX options market could be providing some extra clues.
The Vanna for May remains flat but becomes sharply negative for June OPEX.
SPX levels of 7300 and 7150 are critical gamma points; breaking these could indicate a potential reversal of the current strong uptrend.
The SPX 7000 level is crucial; regardless of geopolitical events, the uptrend will continue as long as this level holds.
Dragon hunting 2.0: SMH
On February 11 2026, I published a note titled ‘Kpop Dragon Hunting’ that examined whether the KOSPI is in a mini bubble using the well-known physics inspired Log-Periodic Power Law (LPPL) model, and whether a pullback is imminent.
“The famous Log-Periodic Power Law (LPPL) model, often associated with the ‘Dragon-Kings’ theory developed by Didier Sornette, is a sophisticated, physics-based framework designed to identify, analyze, and forecast the collapse of speculative bubbles in financial markets.”
In trading terms, if a bull market is already trading a few standard deviations above its historical average, but instead of slowing down, it begins to accelerate rapidly, this suggests the market might be a ‘Dragon’, a bubble.
This model suggests that the near-term forward returns after the signal is triggered tend to be weak.
The note concluded that the South Korean KOSPI is in a small bubble and may decline to the 5000-4900 range.
The red dots on the KOSPI chart highlight model signals indicating a bubble.
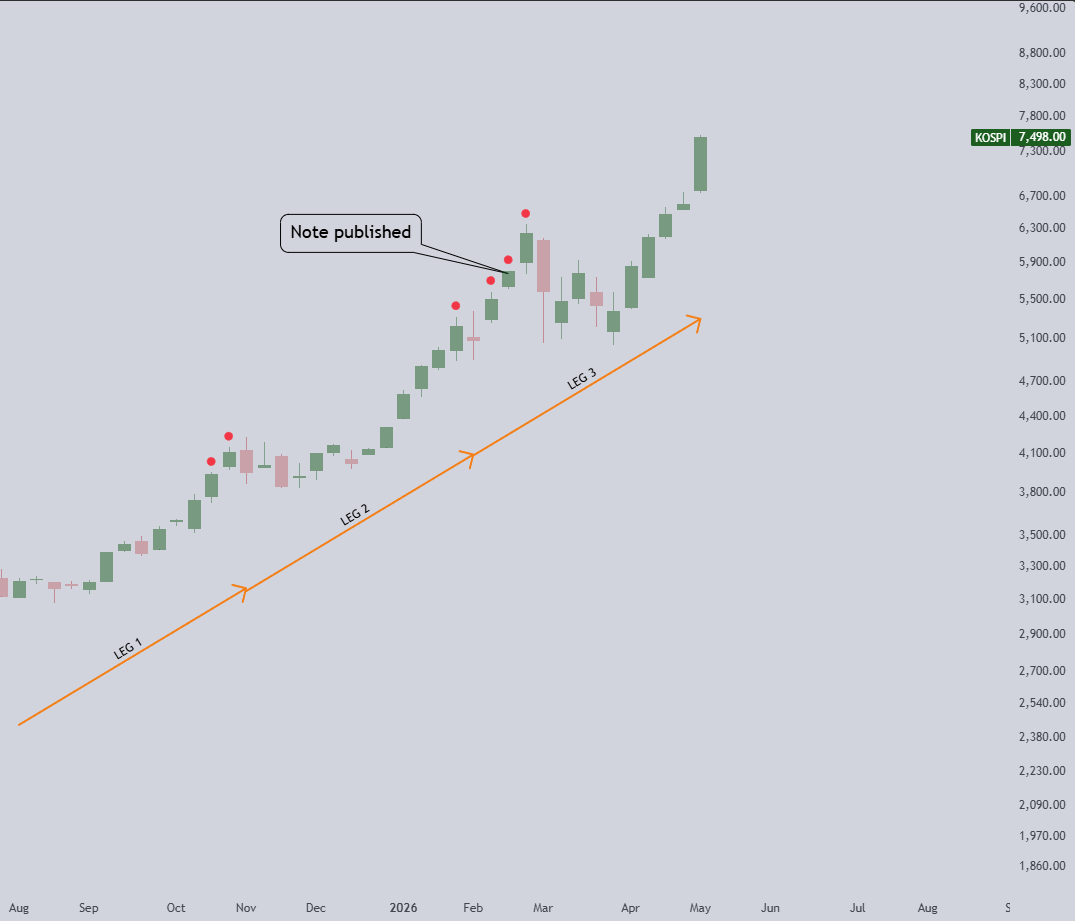
Kospi declined, formed a double bottom near the 5000 mark, and then surged higher again, driven by strong semiconductor chip orders. Note that the growth rate of these orders is unlikely to continue rising from this point.
Dragon-King confirmed: Semiconductor ETF SMH
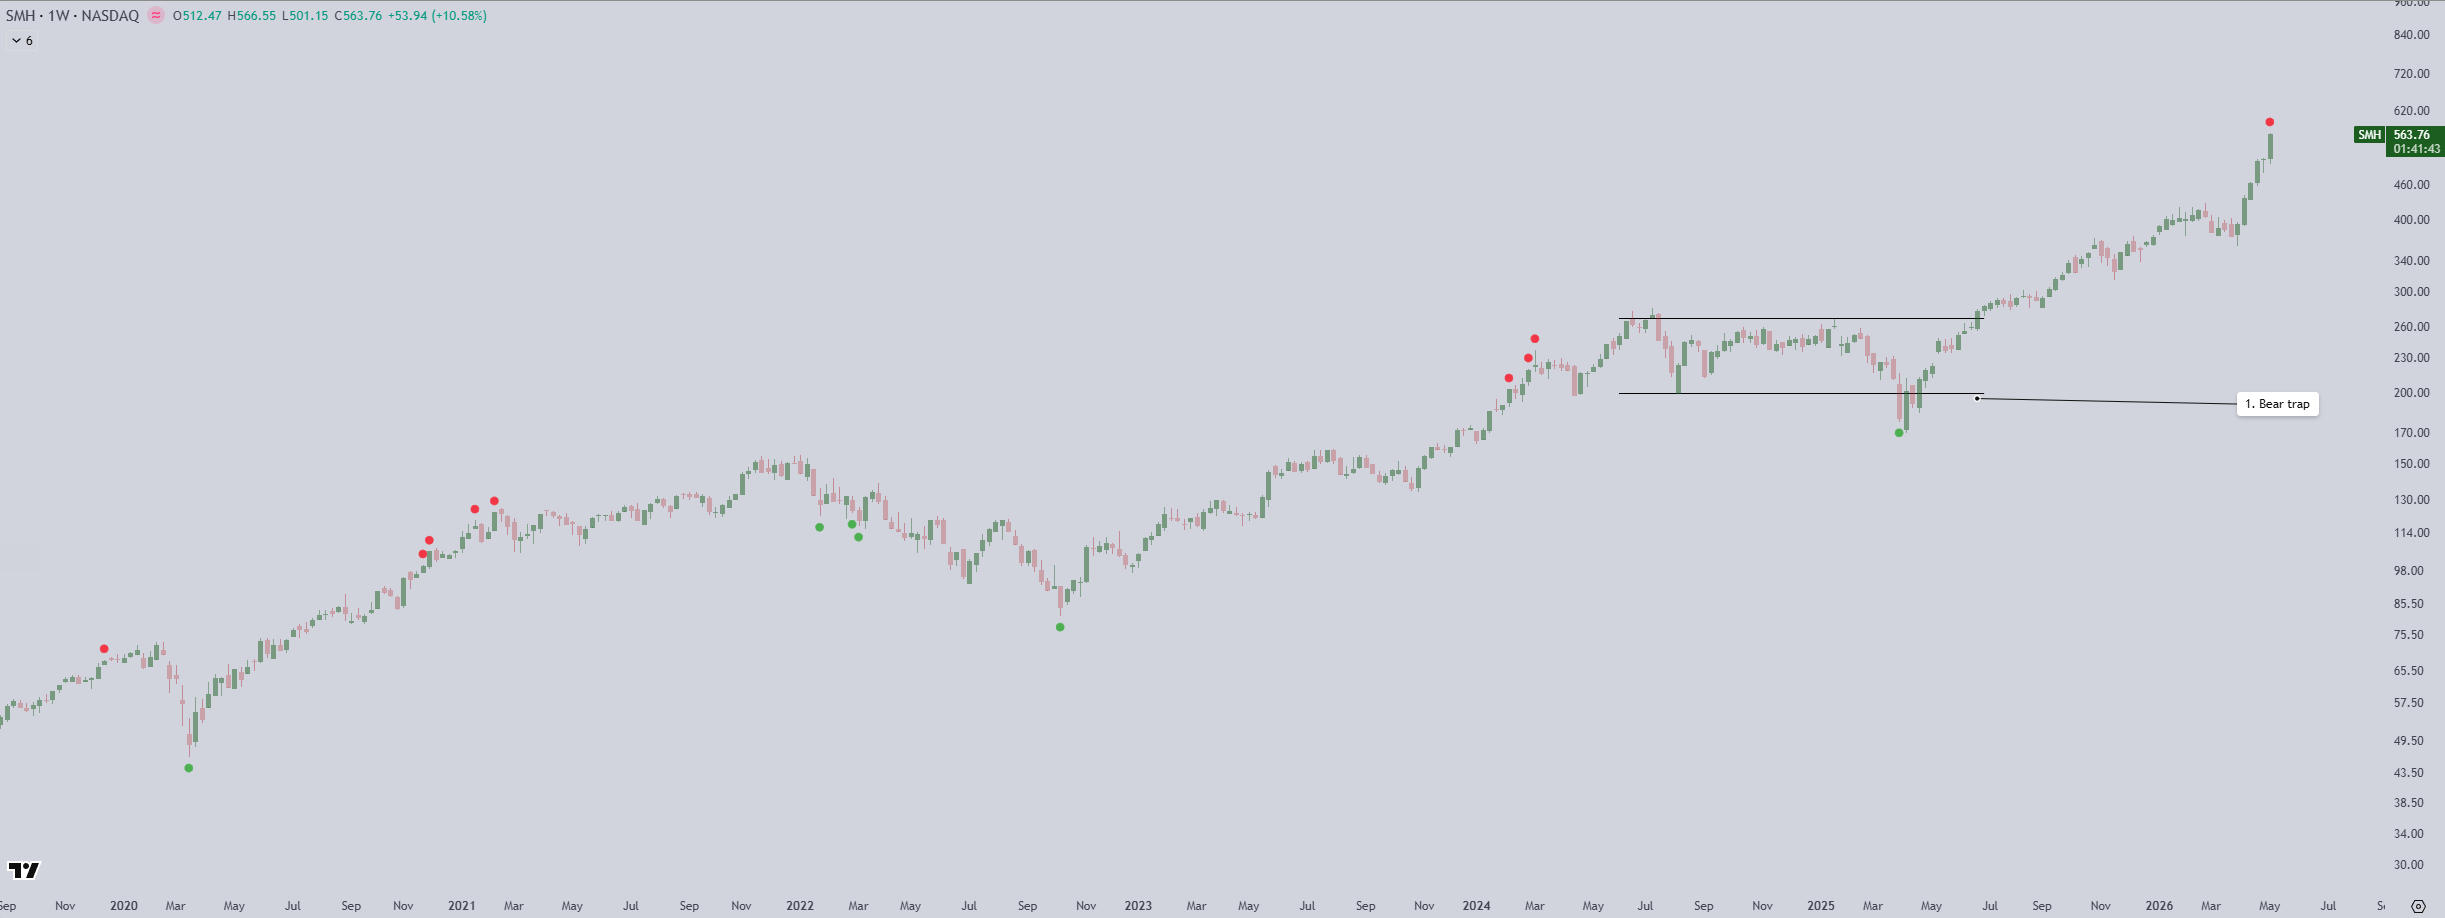
The mini-bubble signal has triggered for SMH, indicating that opening a new long position in the semiconductor sector offers a very poor reward/risk ratio.
The weekly chart of SMH shows current and past bubble signals in red, with anti-bubble signals in green.
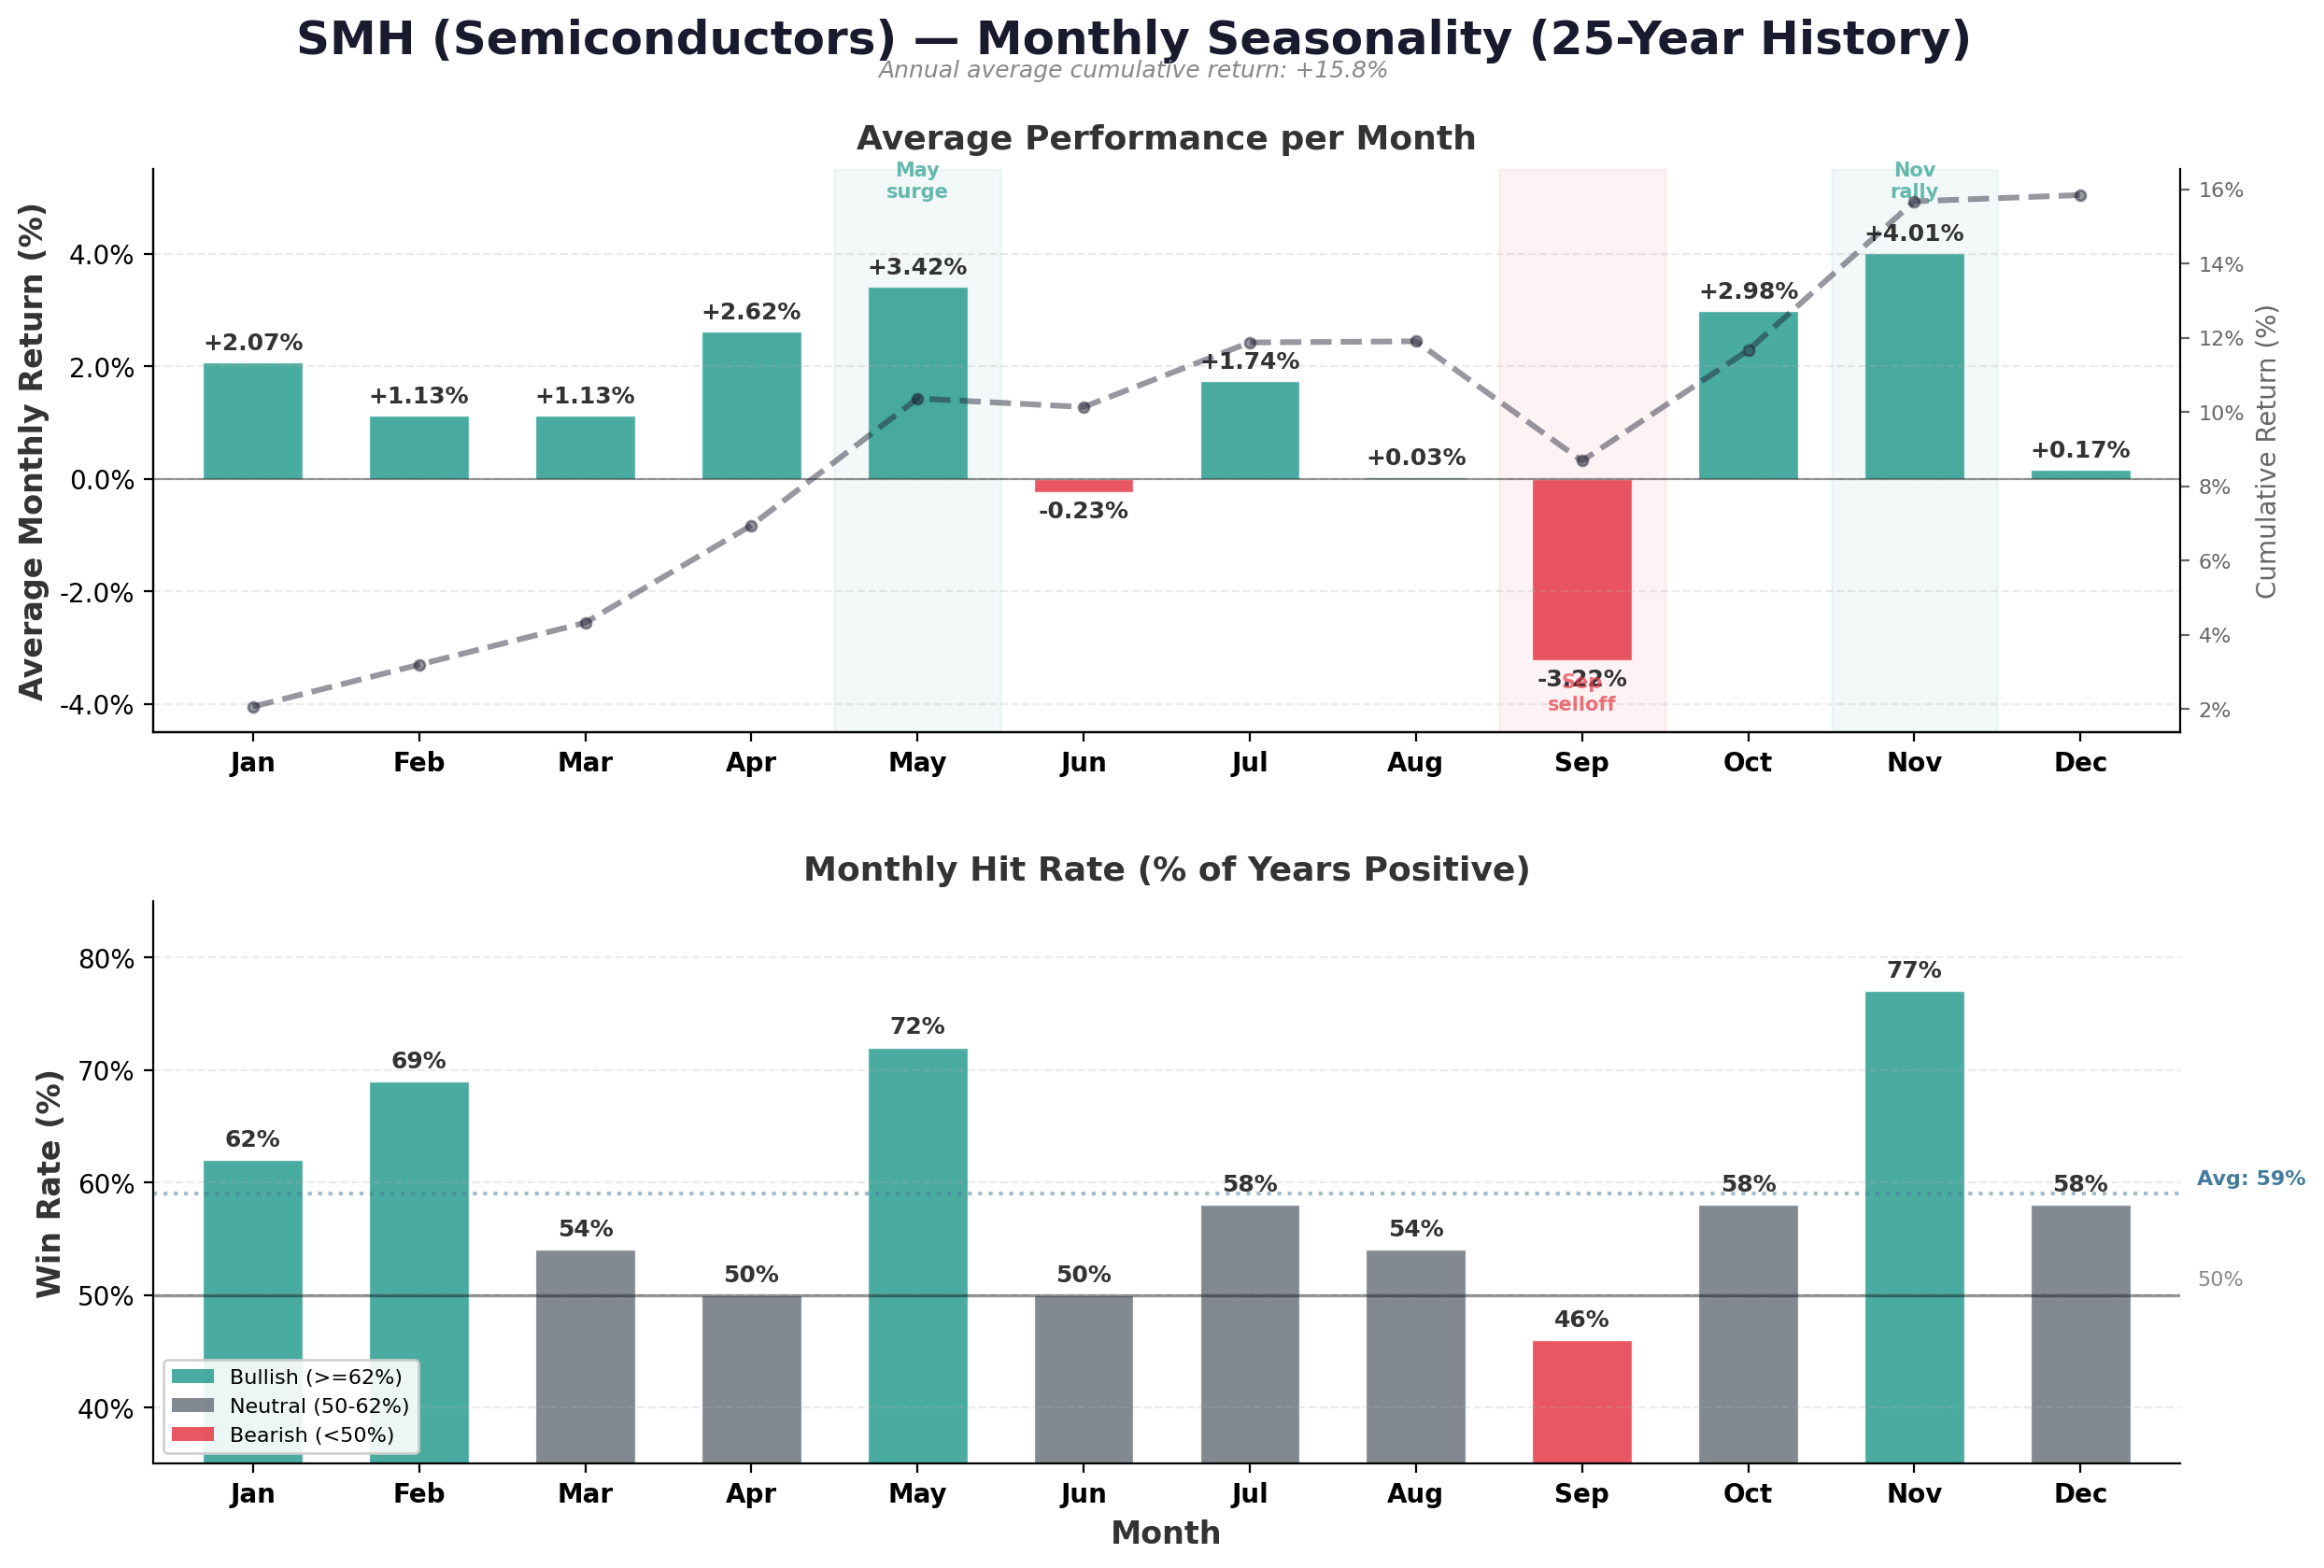
May is an exceptionally strong month for semiconductors overall, but the seasonality tends to weaken after May.
My approach to this bubble signal is to tighten my stops in my semi exposures: AMD, MU.
Here’s a chart of my AMD trade. It has moved too quickly and too far, so I am comfortable overriding my systematic trailing stop and tightening it now.
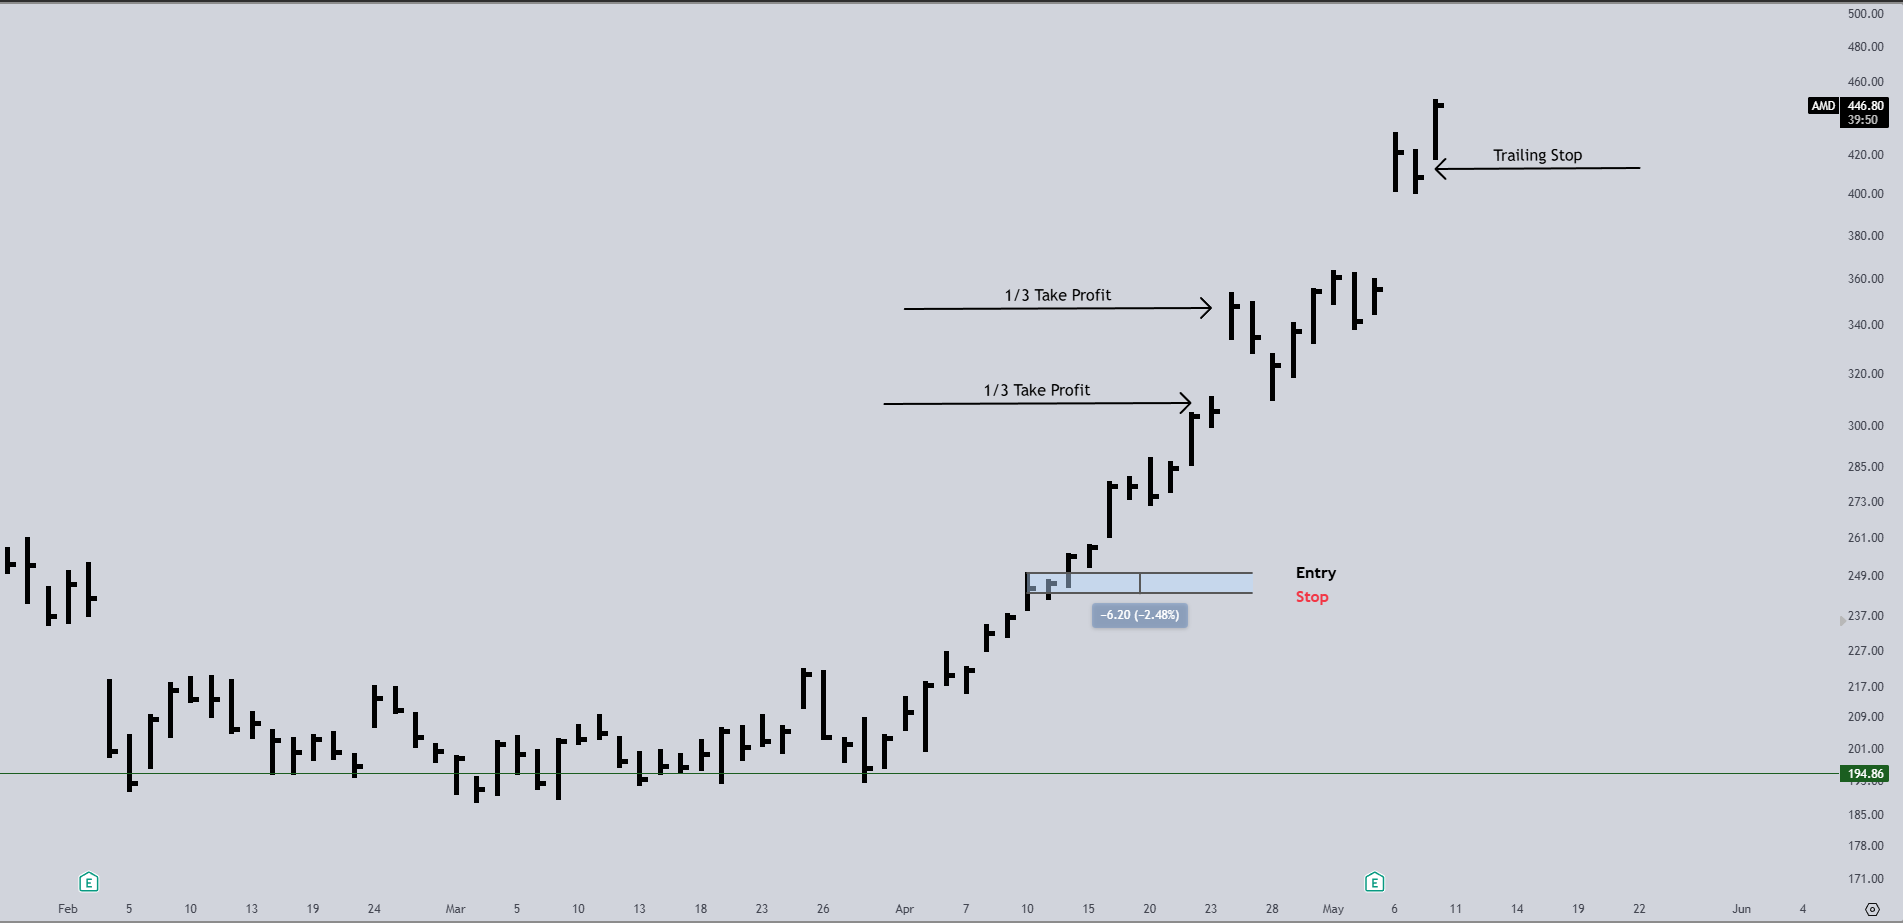
I became interested in AMD in early April: chat thread here. Then I followed up here.
Actionable insights:
The S&P 500 remains in an uptrend until the 7000 level is breached.
The Semiconductor ETF SMH has flashed a bubble warning, which usually results in sideways movement and flat returns over the next 1-2 months. Do not short the ETF impulsively based solely on this signal.
Consider tightening stops on long semiconductor positions and related exposures.
In the near term, if you are inclined to short this market, start a position if SPX breaks below 7300, and add more below 7150, with a target of 7000.
The 7000 level on the SPX is significant and will likely hold unless the US/Iran conflict truly escalates.
In June, the likelihood of the SPX falling below 7000 increases compared to May.
Cheers and good luck!
Great analysis! I find it valuable.
Fantastic analysis